The Riemann Zeta Function
Definition
![]() is the original
definition for this function. Using the Fundamental Theorem of Arithmetic,
Euler proved that
is the original
definition for this function. Using the Fundamental Theorem of Arithmetic,
Euler proved that  . Therefore, due to this function, we have a relationship
between the integers and the primes. Certainly, this can put a very strict
lower bound on the nth prime. However, this is just the beginning.
Primes
If we take the logarithm of the zeta function, we
get an integral which contains pi(x), which is the number of primes not
exceeding x. This formula is ![]() . This comes from the Euler product definition of the zeta
function and performing a few manipulations. Also the pi function can be
approximated very well with the zeta function with the following equation:
. This comes from the Euler product definition of the zeta
function and performing a few manipulations. Also the pi function can be
approximated very well with the zeta function with the following equation: ![]() .
.
Convergence
If s>1, then the zeta function will converge. This follows directly from the integral test. So we have a zeta function for s>1. When s=1, we have the diverging harmonic series.
Analytic Continuation
What if we need zeta(s) for s<1? Georg
Friedrich Bernhard Riemann proved the following formula as an analytic
continuation for zeta(s) for all ![]() . This formula is
. This formula is ![]() . However, it is not so easy to get arbitrary gamma values or
arbitrary zeta functions, even when the infinite summation does hold. However,
gamma values are known for all integers or half-integers. Similarly, zeta
values are known for all positive even integers. This is equivalent to the
integral analytic continuation,
. However, it is not so easy to get arbitrary gamma values or
arbitrary zeta functions, even when the infinite summation does hold. However,
gamma values are known for all integers or half-integers. Similarly, zeta
values are known for all positive even integers. This is equivalent to the
integral analytic continuation, ![]() , where
, where  .
.
The Crux of the Matter: The Riemann
Hypothesis
Riemann conjectured that all nontrivial
zeroes of zeta(s) have real part equal to ½. In symbolic parlance, this states
that if ![]() , then
, then ![]() . This is a remarkable conjecture. Modern mathematicians have
no idea how Riemann came to this conclusion, considering he did not have any
computer algebra system to help him back in 1859. However, this conjecture is
supported by numerical evidence. Computers have checked that the first billion
zeroes (i.e. those closest to the real axis) do indeed lie on the line. With
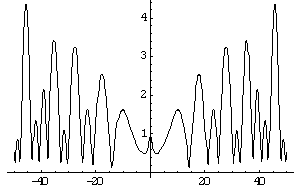
Mathematica 4.0, it is easy to generate a graph of
. This is a remarkable conjecture. Modern mathematicians have
no idea how Riemann came to this conclusion, considering he did not have any
computer algebra system to help him back in 1859. However, this conjecture is
supported by numerical evidence. Computers have checked that the first billion
zeroes (i.e. those closest to the real axis) do indeed lie on the line. With
Mathematica 4.0, it is easy to generate a graph of ![]() :
:  .
Actually the graph represents the absolute value so that it is simpler to
visualize. Mathematica cannot generate a complex-valued complex functional
graph.
It is also possible to graph ![]() , for example:
, for example:  . This one never reaches
0. Clearly numerical evidence supports the Riemann hypothesis, but that is
certainly not a proof.
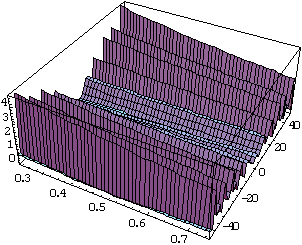
Mathematica also allows us to create a 3D graph of ![]() :
:  .
Here is a zoom-in of the 3D graph close to the critical line:
  .
.